Solutions
Solutions to Try Its
1. x-intercept is [latex]\left(4,0\right)[/latex]; y-intercept is [latex]\left(0,3\right)[/latex]. 2. [latex]\left(-5,\frac{5}{2}\right)[/latex]
Solutions to Odd-Numbered Exercises
1. Answers may vary. Yes. It is possible for a point to be on the x-axis or on the y-axis and therefore is considered to NOT be in one of the quadrants. 3. The y-intercept is the point where the graph crosses the y-axis. 5. The x-intercept is [latex]\left(2,0\right)[/latex] and the y-intercept is [latex]\left(0,6\right)[/latex]. 7. The x-intercept is [latex]\left(2,0\right)[/latex] and the y-intercept is [latex]\left(0,-3\right)[/latex]. 9. The x-intercept is [latex]\left(3,0\right)[/latex] and the y-intercept is [latex]\left(0,\frac{9}{8}\right)[/latex]. 11. [latex]y=4 - 2x[/latex] 13. [latex]y=\frac{5 - 2x}{3}[/latex] 15. [latex]y=2x-\frac{4}{5}[/latex] 17. [latex]d=\sqrt{74}[/latex] 19. [latex]d=\sqrt{36}=6[/latex] 21. [latex]d\approx 62.97[/latex] 23. [latex]\left(3,\frac{-3}{2}\right)[/latex] 25. [latex]\left(2,-1\right)[/latex] 27. [latex]\left(0,0\right)[/latex] 29. [latex]y=0[/latex] 31. not collinear 33. [latex]\left(-3,2\right),\left(1,3\right),\left(4,0\right)[/latex]
35.
33. [latex]\left(-3,2\right),\left(1,3\right),\left(4,0\right)[/latex]
35.
| [latex]x[/latex] | [latex]y[/latex] |
| [latex]-3[/latex] | 1 |
| 0 | 2 |
| 3 | 3 |
| 6 | 4 |
 37.
37.
| x | y |
| –3 | 0 |
| 0 | 1.5 |
| 3 | 3 |
 39.
39.
 41.
41.
 43. [latex]d=8.246[/latex]
45. [latex]d=5[/latex]
47. [latex]\left(-3,4\right)[/latex]
49. [latex]x=0\text{ }y=-2[/latex]
51. [latex]x=0.75\text{ }y=0[/latex]
53. [latex]x=-1.667\text{ }y=0[/latex]
55. [latex]\text{15}\text{-11}.\text{2 }=\text{ 3}.8[/latex] mi shorter
57. [latex]\text{6}.0\text{42}[/latex]
59. Midpoint of each diagonal is the same point [latex]\left(2,2\right)[/latex]. Note this is a characteristic of rectangles, but not other quadrilaterals.
61. [latex]\text{37}[/latex] mi
63. 54 ft
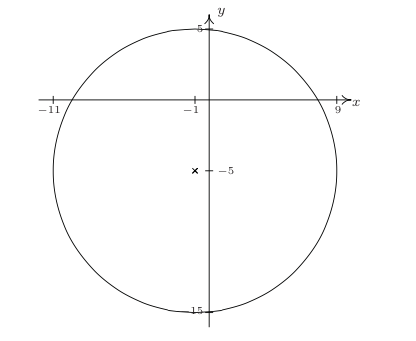
65. [latex]{\left(x+1\right)}^{2}+{\left(y+5\right)}^{2}=100\\[/latex]
43. [latex]d=8.246[/latex]
45. [latex]d=5[/latex]
47. [latex]\left(-3,4\right)[/latex]
49. [latex]x=0\text{ }y=-2[/latex]
51. [latex]x=0.75\text{ }y=0[/latex]
53. [latex]x=-1.667\text{ }y=0[/latex]
55. [latex]\text{15}\text{-11}.\text{2 }=\text{ 3}.8[/latex] mi shorter
57. [latex]\text{6}.0\text{42}[/latex]
59. Midpoint of each diagonal is the same point [latex]\left(2,2\right)[/latex]. Note this is a characteristic of rectangles, but not other quadrilaterals.
61. [latex]\text{37}[/latex] mi
63. 54 ft
65. [latex]{\left(x+1\right)}^{2}+{\left(y+5\right)}^{2}=100\\[/latex]
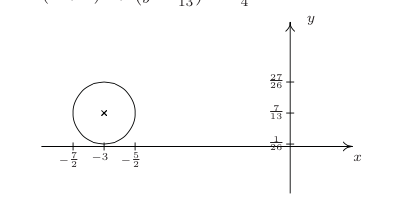
 67. [latex]{\left(x+3\right)}^{2}+{\left(y-\frac{7}{13}\right)}^{2}=\frac{1}{4}\\[/latex]
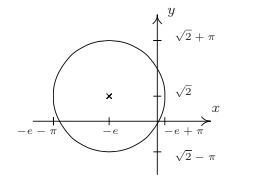
 69. [latex]{\left(x+e\right)}^{2}+{\left(y-\sqrt{2}\right)}^{2}={\pi}^{2}\\[/latex]
 71. [latex]{\left(x-2\right)}^{2}+{\left(y-5\right)}^{2}=4\\[/latex], Center (2,-5), radius r = 2
73. [latex]{\left(x+4\right)}^{2}+{\left(y-5\right)}^{2}=42\\[/latex], Center (-4,5), radius r = [latex]\sqrt{42}\\[/latex]
75. [latex]{\left(x\right)}^{2}+{\left(y-3\right)}^{2}=0\\[/latex], This is not a circle
77. [latex]{\left(x-3\right)}^{2}+{\left(y-5\right)}^{2}=65\\[/latex]
79. [latex]{\left(x-1\right)}^{2}+{\left(y-5\right)}^{2}=5\\[/latex]
81. [latex]{\left(x\right)}^{2}+{\left(y-72\right)}^{2}=4096\\[/latex]
71. [latex]{\left(x-2\right)}^{2}+{\left(y-5\right)}^{2}=4\\[/latex], Center (2,-5), radius r = 2
73. [latex]{\left(x+4\right)}^{2}+{\left(y-5\right)}^{2}=42\\[/latex], Center (-4,5), radius r = [latex]\sqrt{42}\\[/latex]
75. [latex]{\left(x\right)}^{2}+{\left(y-3\right)}^{2}=0\\[/latex], This is not a circle
77. [latex]{\left(x-3\right)}^{2}+{\left(y-5\right)}^{2}=65\\[/latex]
79. [latex]{\left(x-1\right)}^{2}+{\left(y-5\right)}^{2}=5\\[/latex]
81. [latex]{\left(x\right)}^{2}+{\left(y-72\right)}^{2}=4096\\[/latex]
