Transformations of Quadratic Functions
Learning Outcomes
- Graph vertical and horizontal shifts of quadratic functions
- Graph vertical compressions and stretches of quadratic functions
- Write the equation of a transformed quadratic function using the vertex form
- Identify the vertex and axis of symmetry for a given quadratic function in vertex form
The standard form of a quadratic function presents the function in the form
[latex]f\left(x\right)=a{\left(x-h\right)}^{2}+k[/latex]
where [latex]\left(h,\text{ }k\right)[/latex] is the vertex. Because the vertex appears in the standard form of the quadratic function, this form is also known as the vertex form of a quadratic function.
The standard form is useful for determining how the graph is transformed from the graph of [latex]y={x}^{2}[/latex]. The figure below is the graph of this basic function.
Shift Up and Down by Changing the Value of [latex]k[/latex]
You can represent a vertical (up, down) shift of the graph of [latex]f(x)=x^2[/latex] by adding or subtracting a constant, [latex]k[/latex].
[latex]f(x)=x^2 + k[/latex]
If [latex]k>0[/latex], the graph shifts upward, whereas if [latex]k<0[/latex], the graph shifts downward.Example
Using an online graphing calculator, plot the function [latex]f(x)=x^2+k[/latex]. Now change the [latex]k[/latex] value to shift the graph down 4 units, then up 4 units.Answer: The equation for the graph of [latex]f(x)=x^2[/latex] that has been shifted up 4 units is [latex-display]f(x)=x^2+4[/latex-display] The equation for the graph of [latex]f(x)=x^2[/latex] that has been shifted down 4 units is [latex-display]f(x)=x^2-4[/latex-display]
Shift left and right by changing the value of [latex]h[/latex]
You can represent a horizontal (left, right) shift of the graph of [latex]f(x)=x^2[/latex] by adding or subtracting a constant, [latex]h[/latex], to the variable [latex]x[/latex], before squaring.
[latex]f(x)=(x-h)^2 [/latex]
If [latex]h>0[/latex], the graph shifts toward the right and if [latex]h<0[/latex], the graph shifts to the left.tip for success
Remember that the negative sign inside the argument of the vertex form of a parabola (in the parentheses with the variable [latex]x[/latex] ) is part of the formula [latex]f(x)=(x-h)^2 +k[/latex]. If [latex]h>0[/latex], we have [latex]f(x)=(x-h)^2 +k[/latex]. You'll see the negative sign, but the graph will shift right. If [latex]h<0[/latex], we have [latex]f(x)=(x-(-h))^2 +k \rightarrow f(x)=(x+h)^2+k[/latex]. You'll see the positive sign, but the graph will shift left.Example
Using an online graphing calculator, plot the function [latex]f(x)=(x-h)^2[/latex]. Now change the [latex]h[/latex] value to shift the graph 2 units to the right, then 2 units to the left.Answer: The equation for the graph of [latex]f(x)=x^2[/latex] that has been shifted right 2 units is
[latex]f(x)=(x-2)^2[/latex]
The equation for the graph of [latex]f(x)=^2[/latex] that has been shifted left 2 units is
[latex]f(x)=(x+2)^2[/latex]
Stretch or compress by changing the value of [latex]a[/latex].
You can represent a stretch or compression (narrowing, widening) of the graph of [latex]f(x)=x^2[/latex] by multiplying the squared variable by a constant, [latex]a[/latex].
[latex]f(x)=ax^2 [/latex]
The magnitude of [latex]a[/latex] indicates the stretch of the graph. If [latex]|a|>1[/latex], the point associated with a particular [latex]x[/latex]-value shifts farther from the [latex]x[/latex]-axis, so the graph appears to become narrower, and there is a vertical stretch. But if [latex]|a|<1[/latex], the point associated with a particular [latex]x[/latex]-value shifts closer to the [latex]x[/latex]-axis, so the graph appears to become wider, but in fact there is a vertical compression.Example
Using an online graphing calculator plot the function [latex]f(x)=ax^2[/latex]. Now adjust the [latex]a[/latex] value to create a graph that has been compressed vertically by a factor of [latex]\frac{1}{2}[/latex] and another that has been vertically stretched by a factor of 3. What are the equations of the two graphs?Answer: The equation for the graph of [latex]f(x)=x^2[/latex] that has been compressed vertically by a factor of [latex]\frac{1}{2}[/latex] is
[latex]f(x)=\frac{1}{2}x^2[/latex]
The equation for the graph of [latex]f(x)=x^2[/latex] that has been vertically stretched by a factor of 3 is[latex]f(x)=3x^2[/latex]
This is the [latex]x[/latex] coordinate of the vertexr and [latex]x=-\dfrac{b}{2a}[/latex] is the axis of symmetry we defined earlier. Setting the constant terms equal gives us:
Example
Using an online graphing calculator plot the function [latex]f\left(x\right)\ =\ a\left(x-h\right)^2+k[/latex]. Now adjust the variables [latex]a,h,k[/latex] to define two quadratic functions whose axis of symmetry is [latex]x=-3[/latex], and whose vertex is [latex](-3, 2)[/latex]. How many potential values are there for [latex]h[/latex] in this scenario? How about [latex]k[/latex]? How about [latex]a[/latex]Answer: There is only one [latex](h,k)[/latex] pair that will satisfy these conditions, [latex](-3,2)[/latex]. The value of [latex]a[/latex] does not affect the line of symmetry or the vertex of a quadratic graph, so [latex]a[/latex] can take on any value.
Challenge Problem
Define a function whose axis of symmetry is [latex]x = -3[/latex], and whose vertex is [latex](-3,2)[/latex] and has an average rate of change of 2 on the interval [latex][-2,0][/latex]. Use the online graphing calculator where you plotted [latex]f\left(x\right)\ =\ a\left(x-h\right)^2+k[/latex] to help with this.Try It
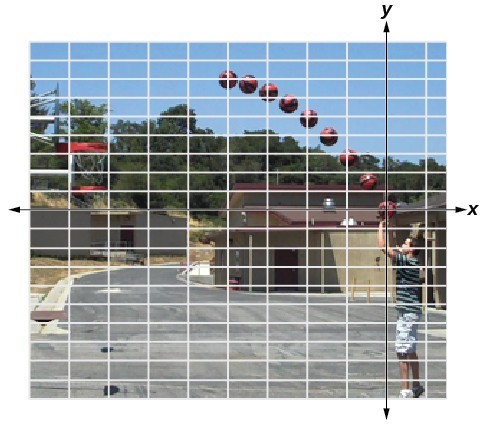
A coordinate grid has been superimposed over the quadratic path of a basketball in the picture below. Find an equation for the path of the ball. Does the shooter make the basket? (credit: modification of work by Dan Meyer)
Answer: The path passes through the origin and has vertex at [latex]\left(-4,\text{ }7\right)[/latex], so [latex]\left(h\right)x=-\frac{7}{16}{\left(x+4\right)}^{2}+7[/latex]. To make the shot, [latex]h\left(-7.5\right)[/latex] would need to be about 4 but [latex]h\left(-7.5\right)\approx 1.64[/latex]; he doesn’t make it.
Licenses & Attributions
CC licensed content, Original
- Interactive: Transform Quadratic 1. Provided by: Lumen Learning (with Desmos) Located at: https://www.desmos.com/calculator/fpatj6tbcn. License: CC BY: Attribution.
- Interactive: Transform Quadratic 2. Provided by: Lumen Learning (with Desmos) Located at: https://www.desmos.com/calculator/5g3xfhkklq. License: CC BY: Attribution.
- Interactive: Transform Quadratic 3. Provided by: Lumen Learning (with Desmos) Located at: https://www.desmos.com/calculator/ha6gh59rq7. License: CC BY: Attribution.
- Interactive: Transform Quadratic 4. Provided by: Lumen Learning (with Desmos) Located at: https://www.desmos.com/calculator/pimelalx4i. License: CC BY: Attribution.
- Revision and Adaptation. Provided by: Lumen Learning License: CC BY: Attribution.
CC licensed content, Shared previously
- College Algebra. Provided by: OpenStax Authored by: Abramson, Jay et al.. Located at: https://openstax.org/books/college-algebra/pages/1-introduction-to-prerequisites. License: CC BY: Attribution. License terms: Download for free at http://cnx.org/contents/[email protected].
