Putting It Together: Linear and Absolute Value Functions
At the start of this module, you were wondering whether you could earn a profit by making bikes and were given a profit function.[latex]P\left(x\right)=R\left(x\right)-C\left(x\right)[/latex]
where,
[latex]x[/latex] = the number of bikes produced and sold
[latex]P(x)[/latex] = profit as a function of x
[latex]R(x)[/latex] = revenue as a function of x
[latex]C(x)[/latex] = cost as a function of x
Profit, revenue, and cost are all linear functions. They are a function of the number of bikes sold. Remember that you were planning to sell each bike for $600, and it cost you $1,600 for fixed costs plus $200 per bike. Since you take in $600 for each bike you sell, revenue is[latex]R\left(x\right)=600x[/latex]
Your costs are $200 per bike plus a fixed cost of $1600, so your overall cost is[latex]C\left(x\right)=200x+1600[/latex]
That means that profit becomes[latex]P\left(x\right)=600x-\left(200x+1600\right)[/latex]
[latex]=400x-1600[/latex]
With that in mind, let’s take another look at the table. The profit is found by subtracting the cost function from the revenue function for each number of bikes.| Number of bikes ([latex]x[/latex]) | Profit ($) |
| 2 | [latex]400\left(2\right)-1600=-800[/latex] (loss) |
| 5 | [latex]400\left(5\right)-1600=400[/latex] |
| 10 | [latex]400\left(10\right)-1600=2400[/latex] |
[latex]R\left(x\right)=C\left(x\right)[/latex]
[latex]600x=200x+1600[/latex]
[latex]400x=1600[/latex]
[latex]x=4[/latex]
That means that if you sell 4 bikes, you will take in the same amount you spend to make the bikes. So selling less than 4 bikes will result in a loss and selling more than 4 bikes will result in a profit. Another method for finding the break-even point is by graphing the two functions. You can use whichever method of graphing you find useful. To plot points, for example, make a list of values for each function. Then use them to determine coordinates that you can plot. [latex-display]R\left(x\right)=600x C\left(x\right)=200x+1600[/latex-display] xC(x) 01600→ (0, 1600) 22000→ (2, 2000) 42400→ (4, 2400) 62800→ (6, 2800) 83200→ (8, 3200)
To use the slope and y-intercept method, first find the y-intercept by setting x = 0. Then determine the slope as the coefficient of the variable, which is the m value.
| x | R(x) | |
| 0 | 0 | → (0, 0) |
| 2 | 1200 | → (2, 1200) |
| 4 | 2400 | → (4, 2400) |
| 6 | 3600 | → (6, 3600) |
| 8 | 4800 | → (8, 4800) |
| y-intercept = 0 | y-intercept = 1600 |
| slope = 600 | slope = 200 |
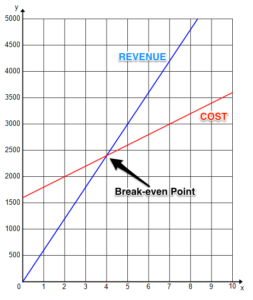 Now we can see the breakpoint right away. It is the point at which the cost function intersects the revenue function because they are equal. It occurs when [latex]x=4[/latex]. At this point you neither make a profit nor incur a loss.
The last question to consider is how changing your price affects your profit. If your costs remain the same, increasing the price you charge will shift your break-even point to a lower number of bikes and increase your revenue for every value of [latex]x[/latex]. But people may not buy as many bikes. Lowering your price will shift your break-even point to a higher number of bikes and decrease your revenue for every value of [latex]x[/latex]. However, more people may buy your bikes.
Let’s take a look at the graphs for two other possible prices.
Now we can see the breakpoint right away. It is the point at which the cost function intersects the revenue function because they are equal. It occurs when [latex]x=4[/latex]. At this point you neither make a profit nor incur a loss.
The last question to consider is how changing your price affects your profit. If your costs remain the same, increasing the price you charge will shift your break-even point to a lower number of bikes and increase your revenue for every value of [latex]x[/latex]. But people may not buy as many bikes. Lowering your price will shift your break-even point to a higher number of bikes and decrease your revenue for every value of [latex]x[/latex]. However, more people may buy your bikes.
Let’s take a look at the graphs for two other possible prices.
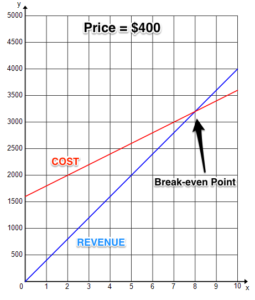
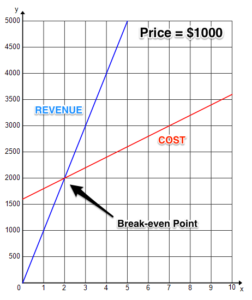 Graphing let’s you quickly see a visual representation of the functions and how they are related to one another. See how the break-even point shifts to 8 bikes for a lower price and only 2 bikes for a higher price.
So writing, graphing, and comparing linear functions can be quite useful. As for deciding what price people are willing to pay for your bike, that’s a whole different topic!
Graphing let’s you quickly see a visual representation of the functions and how they are related to one another. See how the break-even point shifts to 8 bikes for a lower price and only 2 bikes for a higher price.
So writing, graphing, and comparing linear functions can be quite useful. As for deciding what price people are willing to pay for your bike, that’s a whole different topic!Licenses & Attributions
CC licensed content, Original
- Putting It Together: Linear and Absolute Value Functions. Authored by: Lumen Learning. License: CC BY: Attribution.
