Solutions for Modeling with Trigonometric Equations
Solutions to Try Its
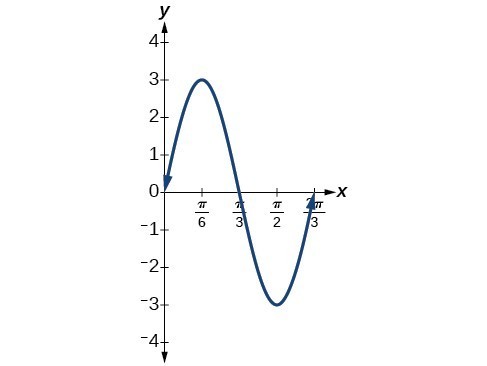
1. The amplitude is [latex]\text{ }3[/latex], and the period is [latex]\text{ }\frac{2}{3}[/latex]. 2.| x | [latex]3\sin \left(3x\right)[/latex] |
|---|---|
| 0 | 0 |
| [latex]\frac{\pi }{6}[/latex] | 3 |
| [latex]\frac{\pi }{3}[/latex] | 0 |
| [latex]\frac{\pi }{2}[/latex] | [latex]-3[/latex] |
| [latex]\frac{2\pi }{3}[/latex] | 0 |
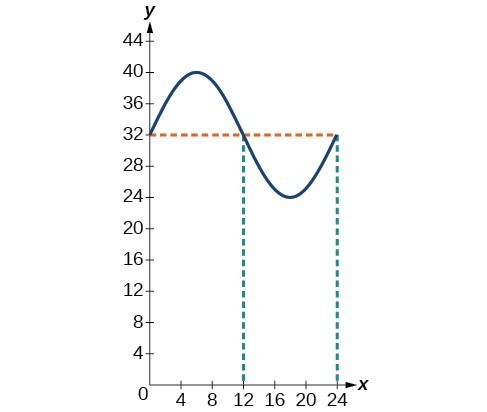
 3. [latex]y=8\sin \left(\frac{\pi }{12}t\right)+32[/latex]
The temperature reaches freezing at noon and at midnight.
3. [latex]y=8\sin \left(\frac{\pi }{12}t\right)+32[/latex]
The temperature reaches freezing at noon and at midnight.
 4. initial displacement =6, damping constant = -6, frequency = [latex]\frac{2}{\pi }[/latex]
5. [latex]y=10{e}^{-0.5t}\cos \left(\pi t\right)[/latex]
6. [latex]y=5\cos \left(6\pi t\right)[/latex]
4. initial displacement =6, damping constant = -6, frequency = [latex]\frac{2}{\pi }[/latex]
5. [latex]y=10{e}^{-0.5t}\cos \left(\pi t\right)[/latex]
6. [latex]y=5\cos \left(6\pi t\right)[/latex]
Solutions to Odd-Numbered Exercises
1. Physical behavior should be periodic, or cyclical. 3. Since cumulative rainfall is always increasing, a sinusoidal function would not be ideal here. 5. [latex]y=-3\cos \left(\frac{\pi }{6}x\right)-1[/latex] 7. [latex]5\sin \left(2x\right)+2[/latex] 9. [latex]4\cos \left(\frac{x\pi }{2}\right)-3[/latex] 11. [latex]5 - 8\sin \left(\frac{x\pi }{2}\right)[/latex] 13. [latex]\tan \left(\frac{x\pi }{12}\right)[/latex] 15. Answers will vary. Sample answer: This function could model temperature changes over the course of one very hot day in Phoenix, Arizona.![Graph of f(x) = -18cos(x*pi/12) - 5sin(x*pi/12) + 100 on the interval [0,24]. There is a single peak around 12.](https://s3-us-west-2.amazonaws.com/courses-images-archive-read-only/wp-content/uploads/sites/923/2015/04/25001621/CNX_Precalc_Figure_07_06_202.jpg) 17. 9 years from now
19. [latex]56^\circ \text{F}[/latex]
21. [latex]1.8024[/latex] hours
23. 4:30
25. From July 8 to October 23
27. From day 19 through day 40
29. Floods: July 24 through October 7. Droughts: February 4 through March 27
31. Amplitude: 11, period: [latex]\frac{1}{6}[/latex], frequency: 6 Hz
33. Amplitude: 5, period: [latex]\frac{1}{30}[/latex], frequency: 30 Hz
35. [latex]P\left(t\right)=-15\cos \left(\frac{\pi }{6}t\right)+650+\frac{55}{6}t[/latex]
37. [latex]P\left(t\right)=-40\cos \left(\frac{\pi }{6}t\right)+800{\left(1.04\right)}^{t}[/latex]
39. [latex]D\left(t\right)=7{\left(0.89\right)}^{t}\cos \left(40\pi t\right)[/latex]
41. [latex]D\left(t\right)=19{\left(0.9265\right)}^{t}\cos \left(26\pi t\right)[/latex]
43. [latex]20.1[/latex] years
45. 17.8 seconds
47. Spring 2 comes to rest first after 8.0 seconds.
49. 500 miles, at [latex]{90}^{\circ }[/latex]
51. [latex]y=6{\left(5\right)}^{x}+4\sin \left(\frac{\pi }{2}x\right)[/latex]
53. [latex]y=8{\left(\frac{1}{2}\right)}^{x}\cos \left(\frac{\pi }{2}x\right)+3[/latex]
17. 9 years from now
19. [latex]56^\circ \text{F}[/latex]
21. [latex]1.8024[/latex] hours
23. 4:30
25. From July 8 to October 23
27. From day 19 through day 40
29. Floods: July 24 through October 7. Droughts: February 4 through March 27
31. Amplitude: 11, period: [latex]\frac{1}{6}[/latex], frequency: 6 Hz
33. Amplitude: 5, period: [latex]\frac{1}{30}[/latex], frequency: 30 Hz
35. [latex]P\left(t\right)=-15\cos \left(\frac{\pi }{6}t\right)+650+\frac{55}{6}t[/latex]
37. [latex]P\left(t\right)=-40\cos \left(\frac{\pi }{6}t\right)+800{\left(1.04\right)}^{t}[/latex]
39. [latex]D\left(t\right)=7{\left(0.89\right)}^{t}\cos \left(40\pi t\right)[/latex]
41. [latex]D\left(t\right)=19{\left(0.9265\right)}^{t}\cos \left(26\pi t\right)[/latex]
43. [latex]20.1[/latex] years
45. 17.8 seconds
47. Spring 2 comes to rest first after 8.0 seconds.
49. 500 miles, at [latex]{90}^{\circ }[/latex]
51. [latex]y=6{\left(5\right)}^{x}+4\sin \left(\frac{\pi }{2}x\right)[/latex]
53. [latex]y=8{\left(\frac{1}{2}\right)}^{x}\cos \left(\frac{\pi }{2}x\right)+3[/latex]Licenses & Attributions
CC licensed content, Specific attribution
- Precalculus. Provided by: OpenStax Authored by: OpenStax College. Located at: https://cnx.org/contents/[email protected]:1/Preface. License: CC BY: Attribution.
