J1.03: Section 1 Part 2
Example 1: Fitting an exponential model to find the growth rate
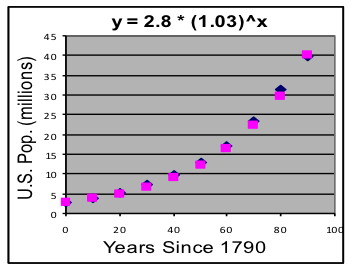
Use this data from the first 10 U.S. censuses to make an exponential model of U.S. population growth, then use that model to answer these questions: [Use the Exponential Model worksheet in Models.xls.]- Does an exponential model fit this data well? How do you know?
- What was the average annual growth rate during this period?
- What population does the model predict for 1900? For 2000?
Solution procedure:
[1] Redefine the input variable to “Years since 1780”, adjusting the x values in column A to start at 0.| Year | Population (millions) |
| 1780 | 2.8 |
| 1790 | 3.9 |
| 1800 | 5.3 |
| 1810 | 7.2 |
| 1820 | 9.6 |
| 1830 | 12.9 |
| 1840 | 17.1 |
| 1850 | 23.2 |
| 1860 | 31.4 |
| 1870 | 39.8 |
- Set G3 to 2.8, the first value in the table. (We can later adjust this to reduce standard deviation).
- Set G4 to 0.01 (which is 1%), then adjust it until the shape of the model is close to that of the data at about 0.03 (which is 3%).
| A | B | C | D | E | F | G | H | |||
| 1 | x | y data | y model | Data-Model | Exponential model: y = a * (1+r)^x | |||||
| 2 | Year-1780 | Height | Prediction | deviation | y = 2.8 * (1+0.03)^x | |||||
| 3 | 0 | 2.8 | 2.80 | 0.0000 | 2.8 | a: Initial value at x=0 | ||||
| 4 | 10 | 3.9 | 3.76 | 0.1370 |
|
0.03 | r: Growth rate | |||
| 5 | 20 | 5.3 | 5.06 | 0.2429 | ||||||
| 6 | 30 | 7.2 | 6.80 | 0.4037 | ||||||
| 7 | 40 | 9.6 | 9.13 | 0.4663 | Model and data value counts | |||||
| 8 | 50 | 12.9 | 12.27 | 0.6251 | 2 | Number of parameters | ||||
| 9 | 60 | 17.1 | 16.50 | 0.6035 | 10 | Number of data points | ||||
| 10 | 70 | 23.2 | 22.17 | 1.0301 | ||||||
| 11 | 80 | 31.4 | 29.79 | 1.6055 | Goodness of fit of this model | |||||
| 12 | 90 | 39.8 | 40.04 | -0.2413 | 4.910062 | Sum of squared deviat | ||||
| 13 | 120 | 97.19 | 0.783427 | Standard deviation | ||||||
| 14 | 220 | 1867.87 | ||||||||
 Answers to questions asked:
[a] Yes, this model fits the data well, since the deviations are only a few percent of the typical population values.
[b] The model growth-rate parameter shows the average annual growth rate of U.S. population from 1780 to 1870 was about 3.0%.
[c] Evaluate the model at 120 (1900 is 120 years since 1780), and 220 (for 2000) to show that a model based on the 1780-1870 census data predicts a U.S. population of about 97 million in 1900 and 1,868 million in 2000. (Actual population was 76 million in 1900 and 281 million in 2000, showing that the rate of U.S. population growth slowed down substantially after 1870.)
Answers to questions asked:
[a] Yes, this model fits the data well, since the deviations are only a few percent of the typical population values.
[b] The model growth-rate parameter shows the average annual growth rate of U.S. population from 1780 to 1870 was about 3.0%.
[c] Evaluate the model at 120 (1900 is 120 years since 1780), and 220 (for 2000) to show that a model based on the 1780-1870 census data predicts a U.S. population of about 97 million in 1900 and 1,868 million in 2000. (Actual population was 76 million in 1900 and 281 million in 2000, showing that the rate of U.S. population growth slowed down substantially after 1870.)Licenses & Attributions
CC licensed content, Shared previously
- Mathematics for Modeling. Authored by: Mary Parker and Hunter Ellinger. License: CC BY: Attribution.
